Reporting period
55 pieces were published in 125 platform placements from 1 July to 30 September 2026.
01 / Publishing
Where the content appeared
Published posts by platform during the reporting period.
02 / Pace
Monthly publishing
July had the most platform posts, followed by September.
| Month | TikTok | Total | |||
|---|---|---|---|---|---|
| July | 17 | 16 | 11 | 3 | 47 |
| August | 12 | 12 | 4 | 6 | 34 |
| September | 16 | 16 | 4 | 8 | 44 |
| Total | 45 | 44 | 19 | 17 | 125 |
03 / Format
Content mix
Pieces are counted once; platform columns count each published placement.
| Type | Pieces | TikTok | |||
|---|---|---|---|---|---|
| Reels (short video) | 26 | 22 | 21 | 19 | – |
| Static graphics | 27 | 21 | 21 | – | 17 |
| Carousels | 2 | 2 | 2 | – | – |
| Total | 55 | 45 | 44 | 19 | 17 |
A piece shared to Facebook and Instagram counts once as a piece and once on each platform.
04 / Themes
What the content covered
- Patient education: what to expect, cost questions, and the common reasons people put off booking.
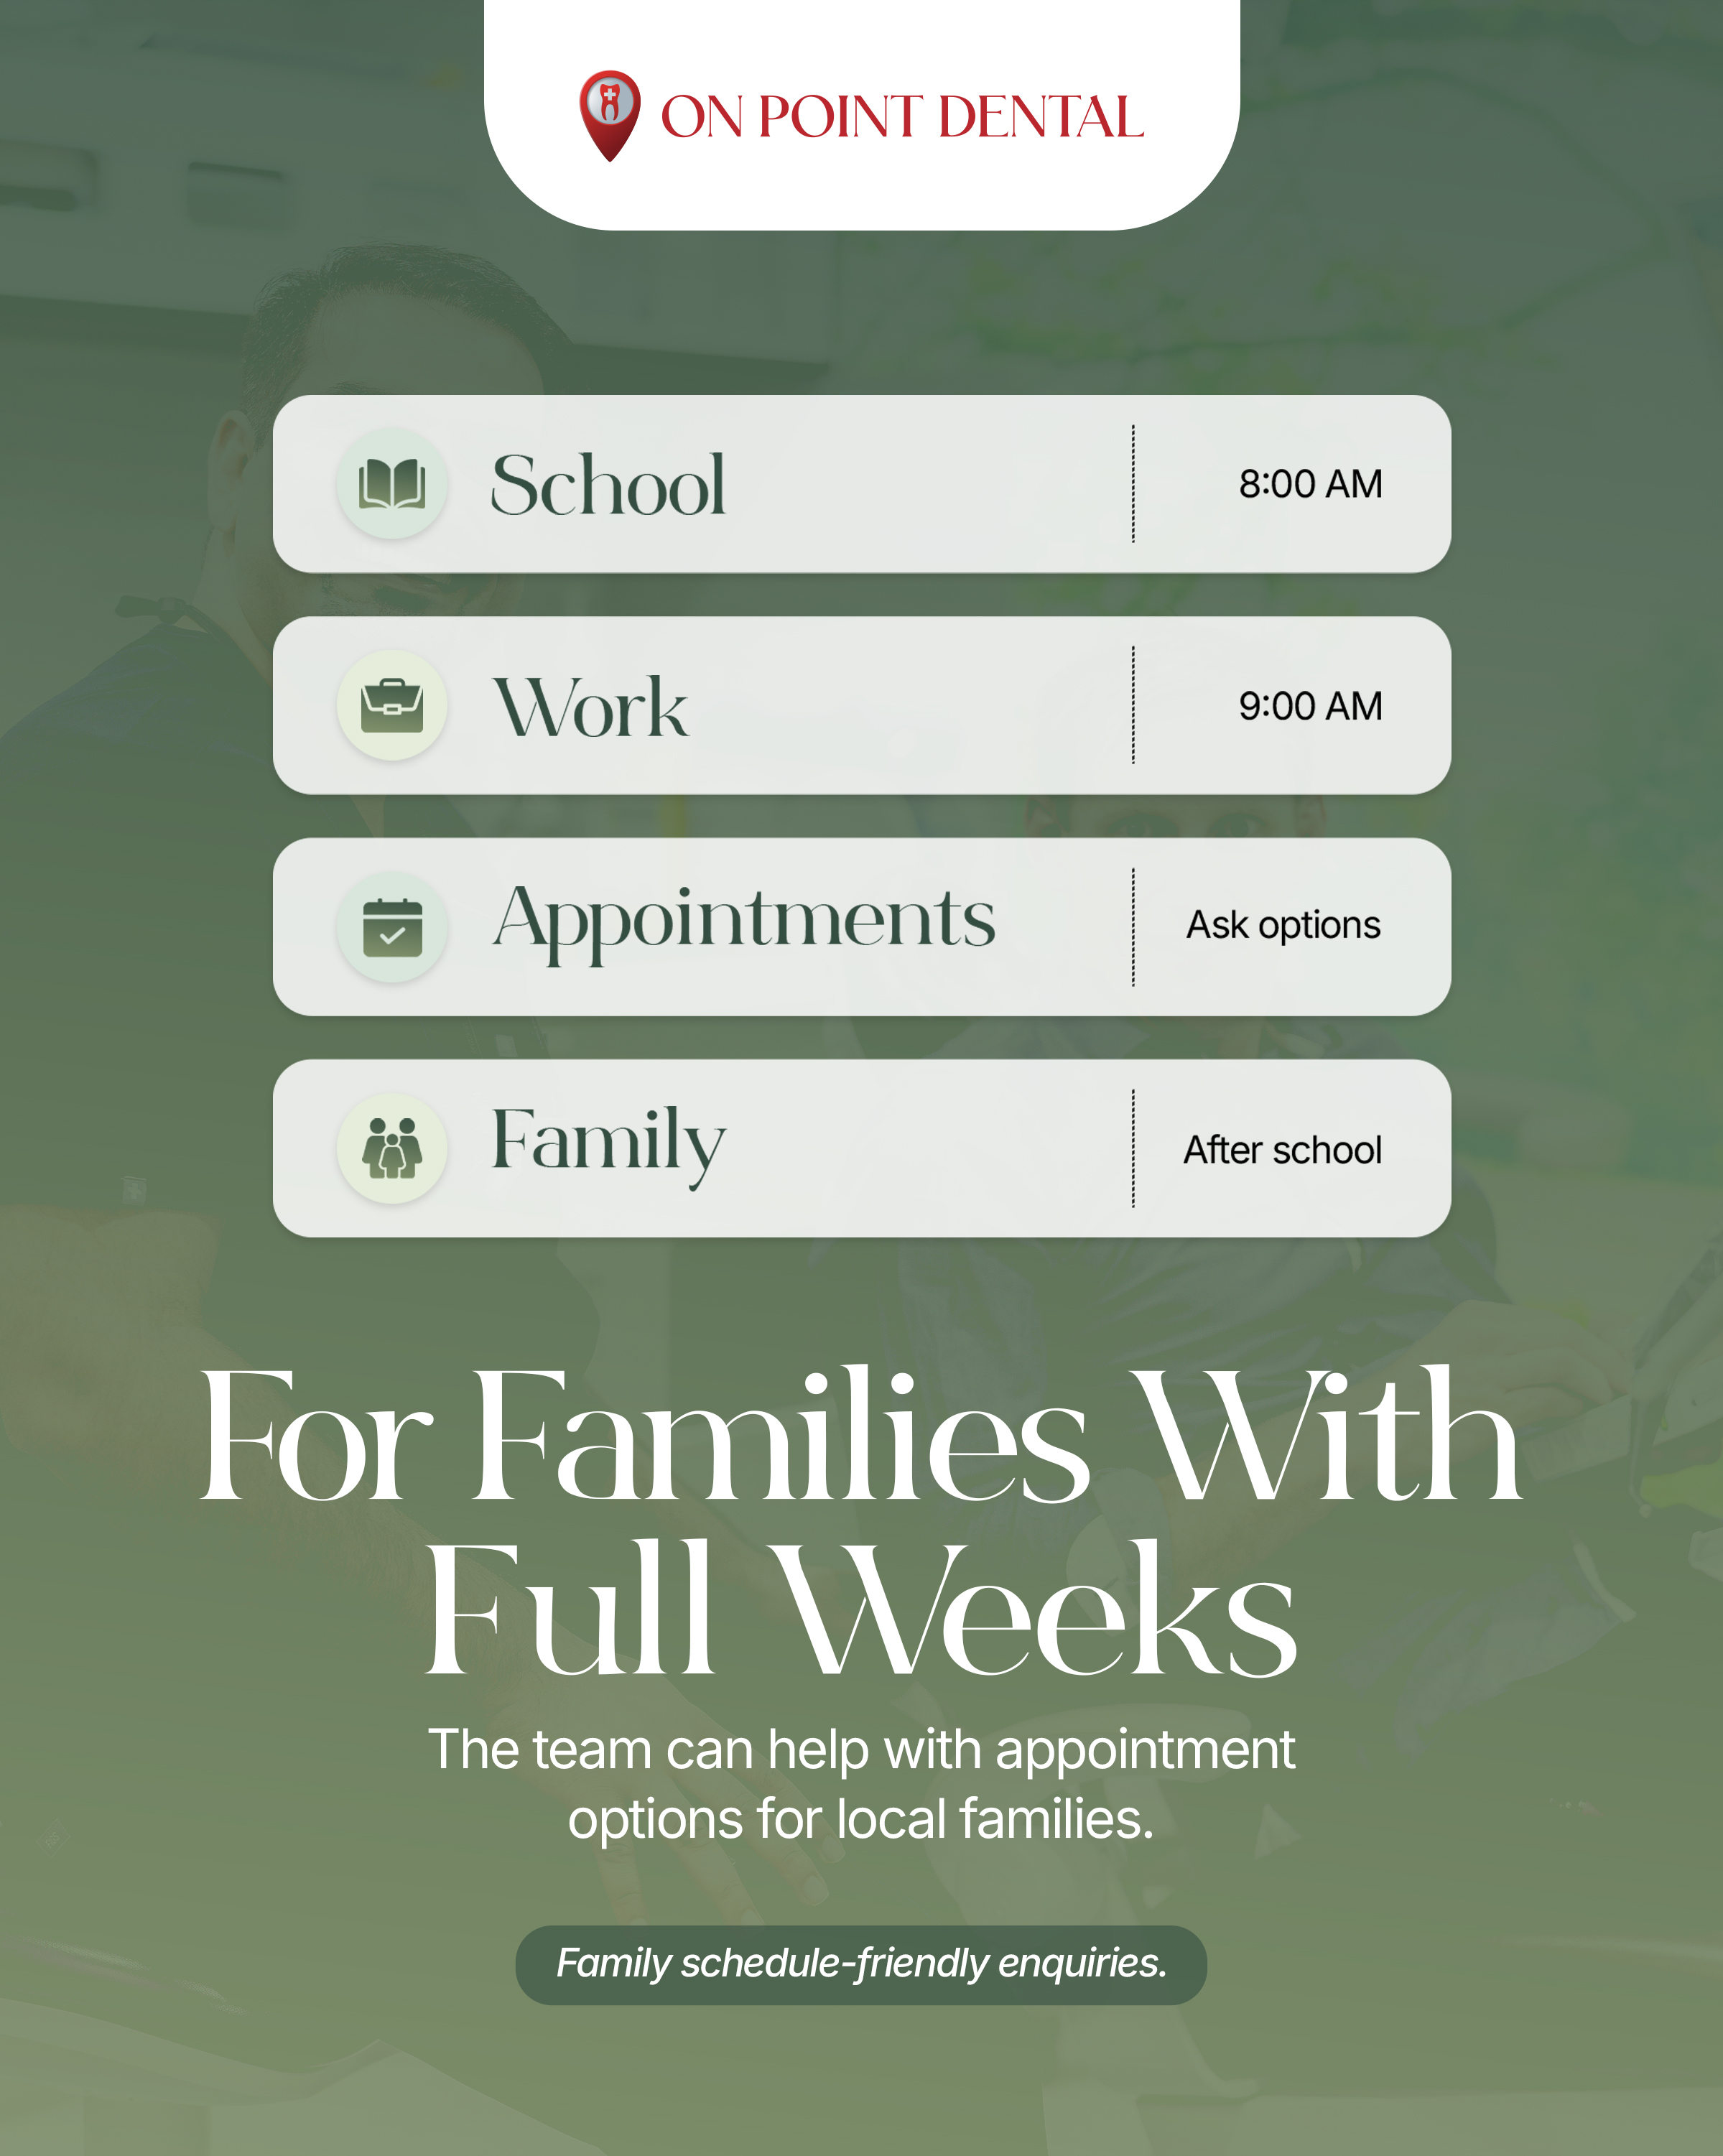
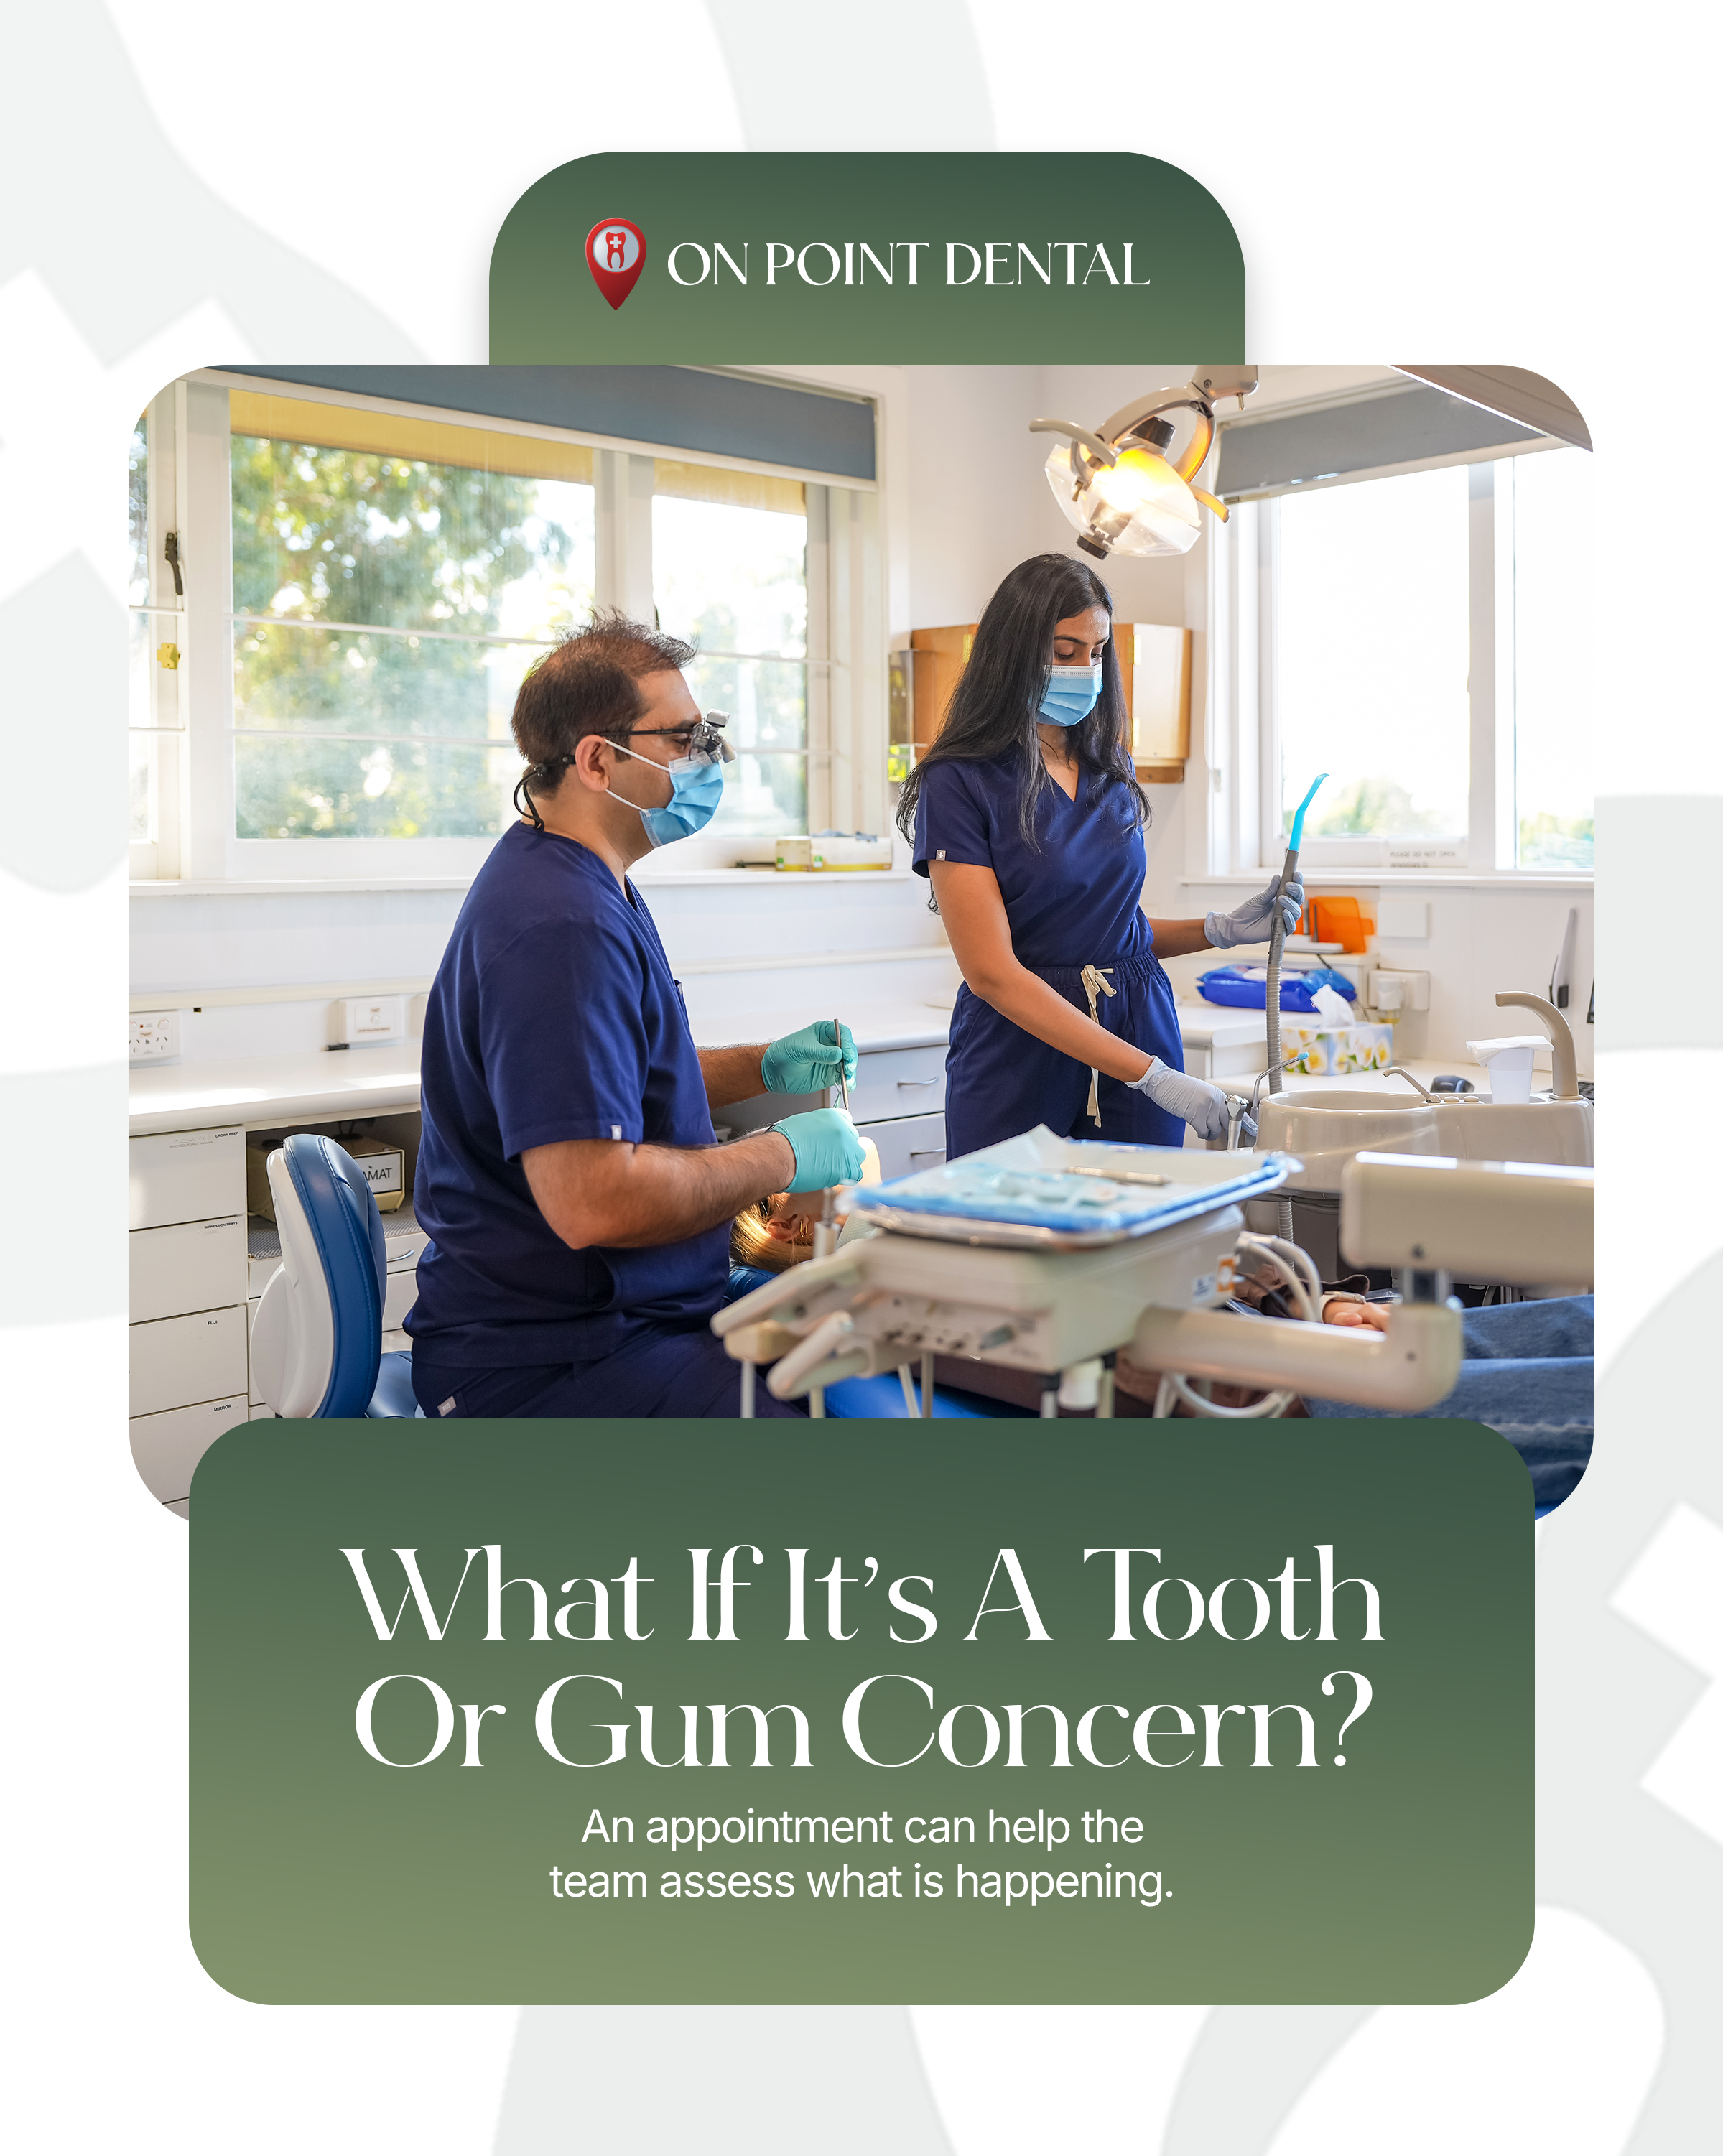
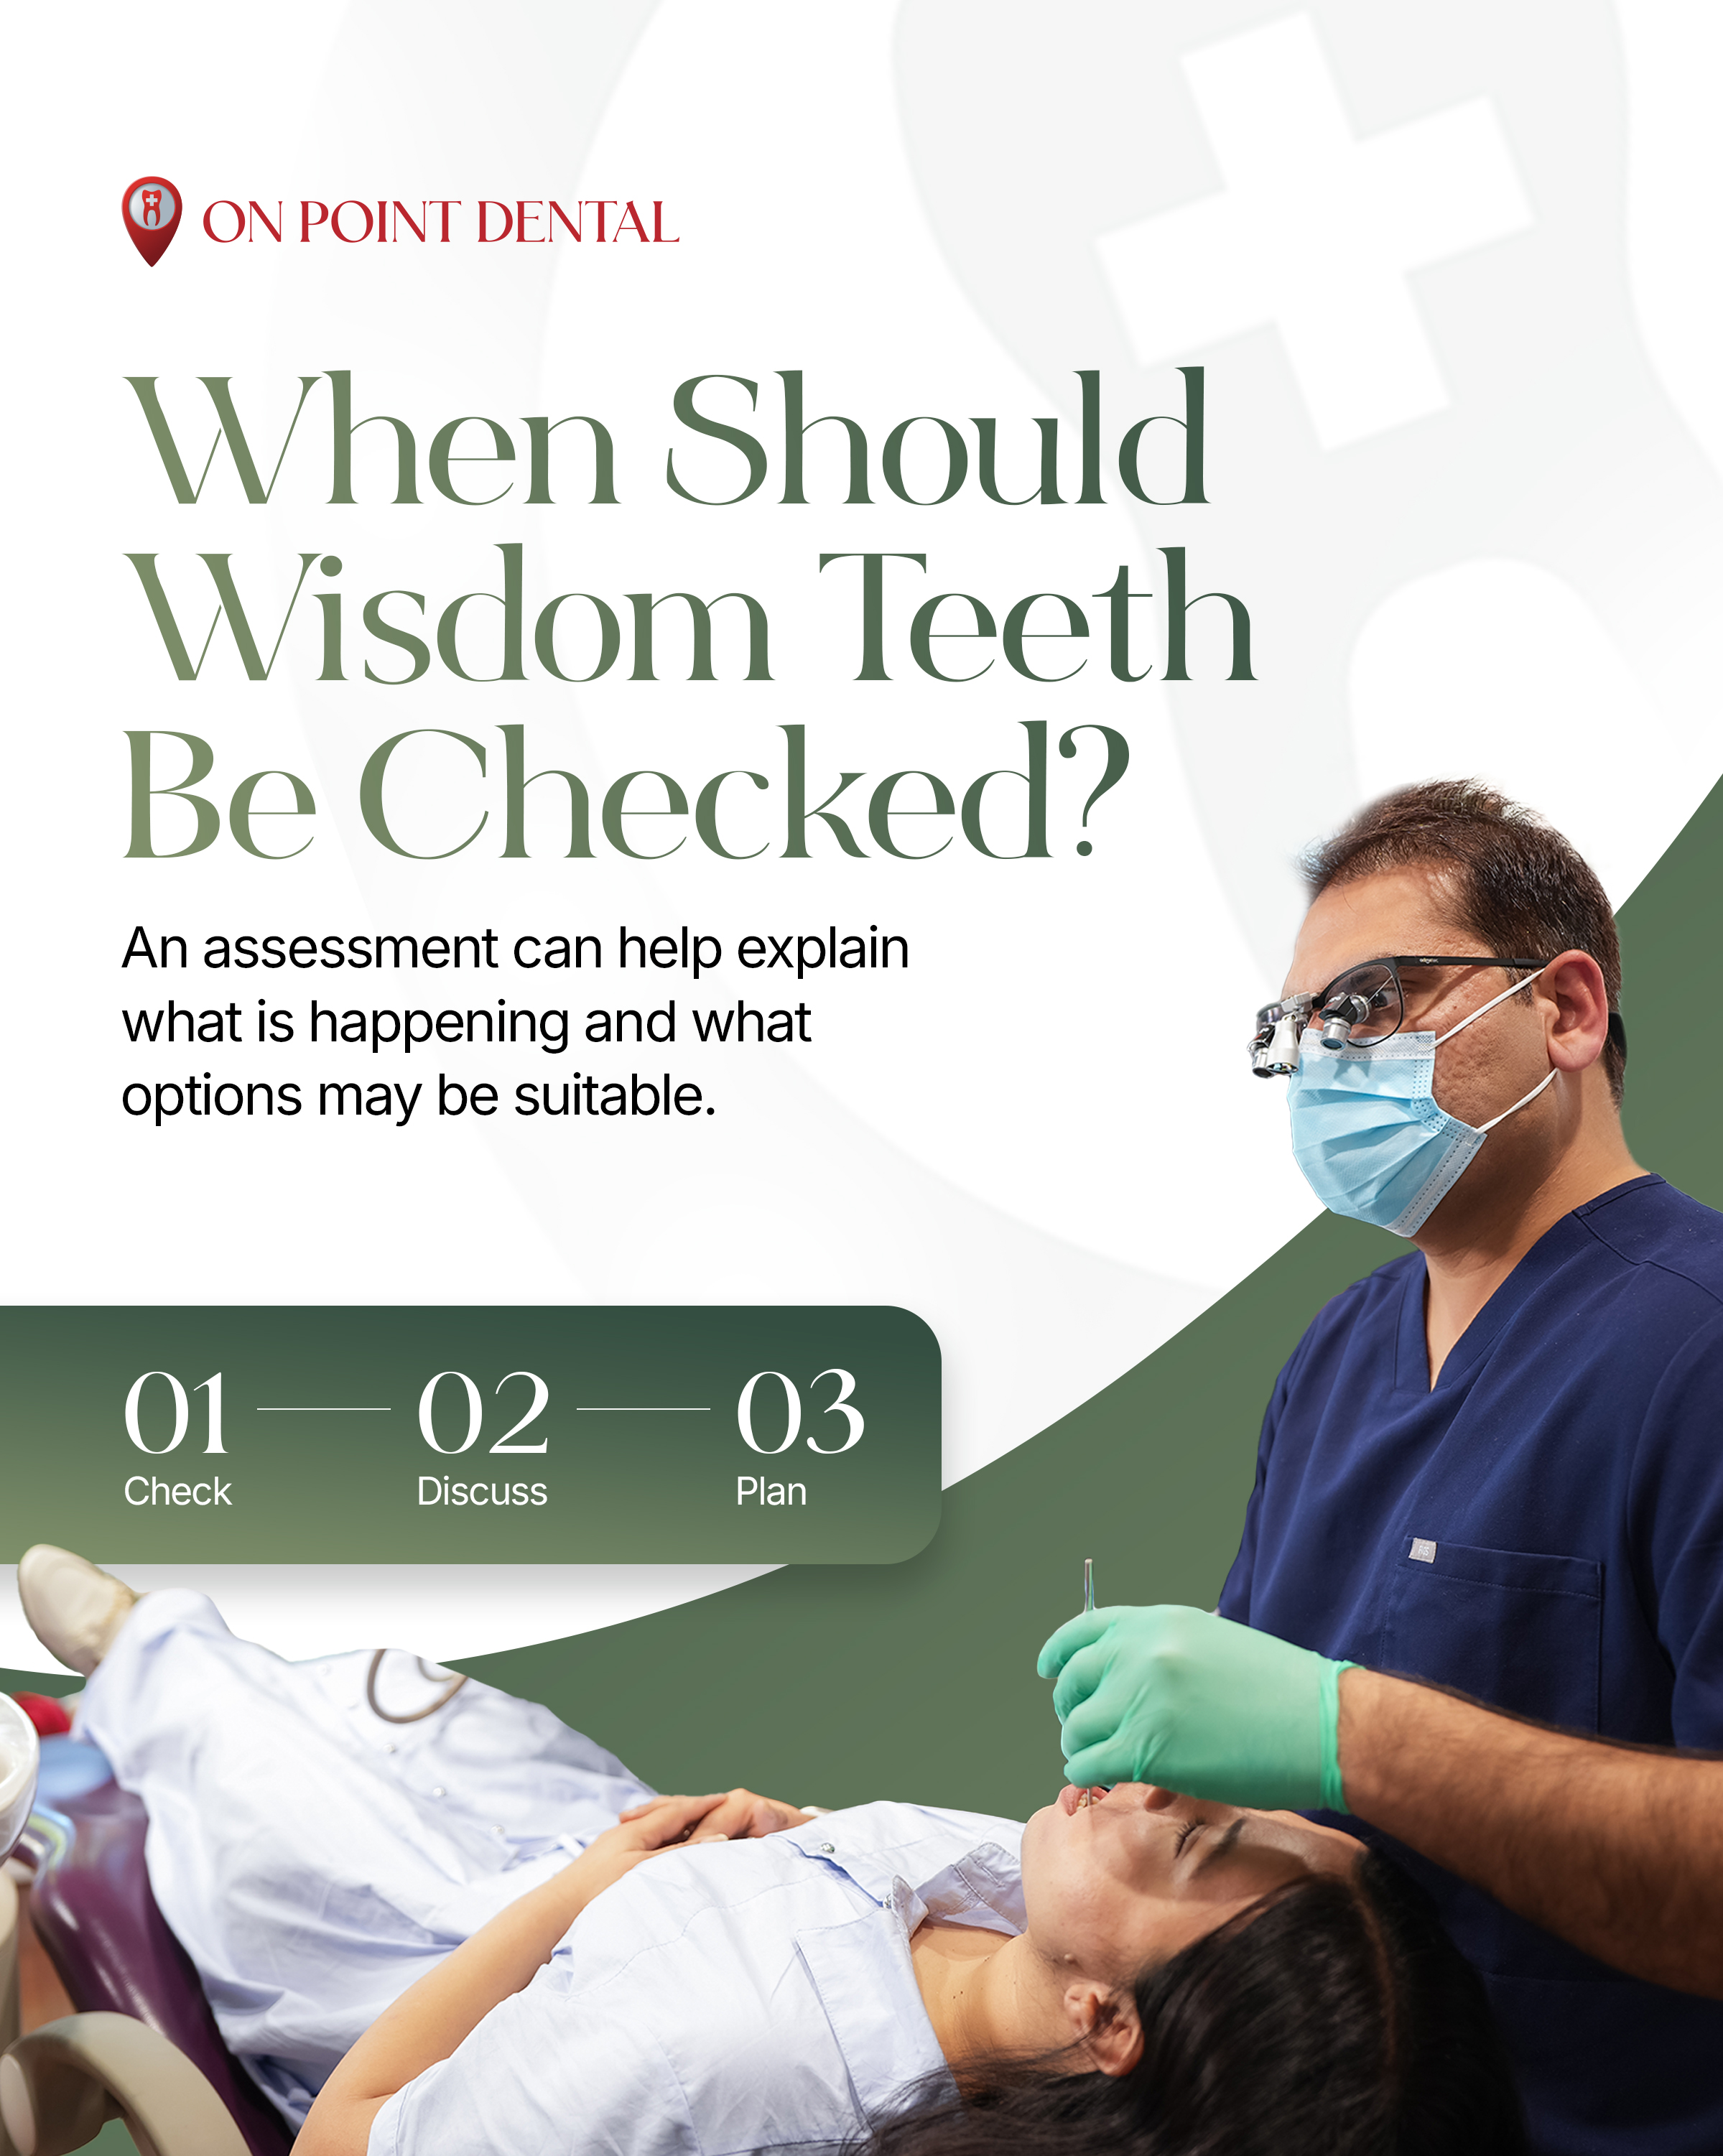
- Treatments explained: dental implants (cost and options), clear aligners, teeth whitening, wisdom teeth and tooth pain.
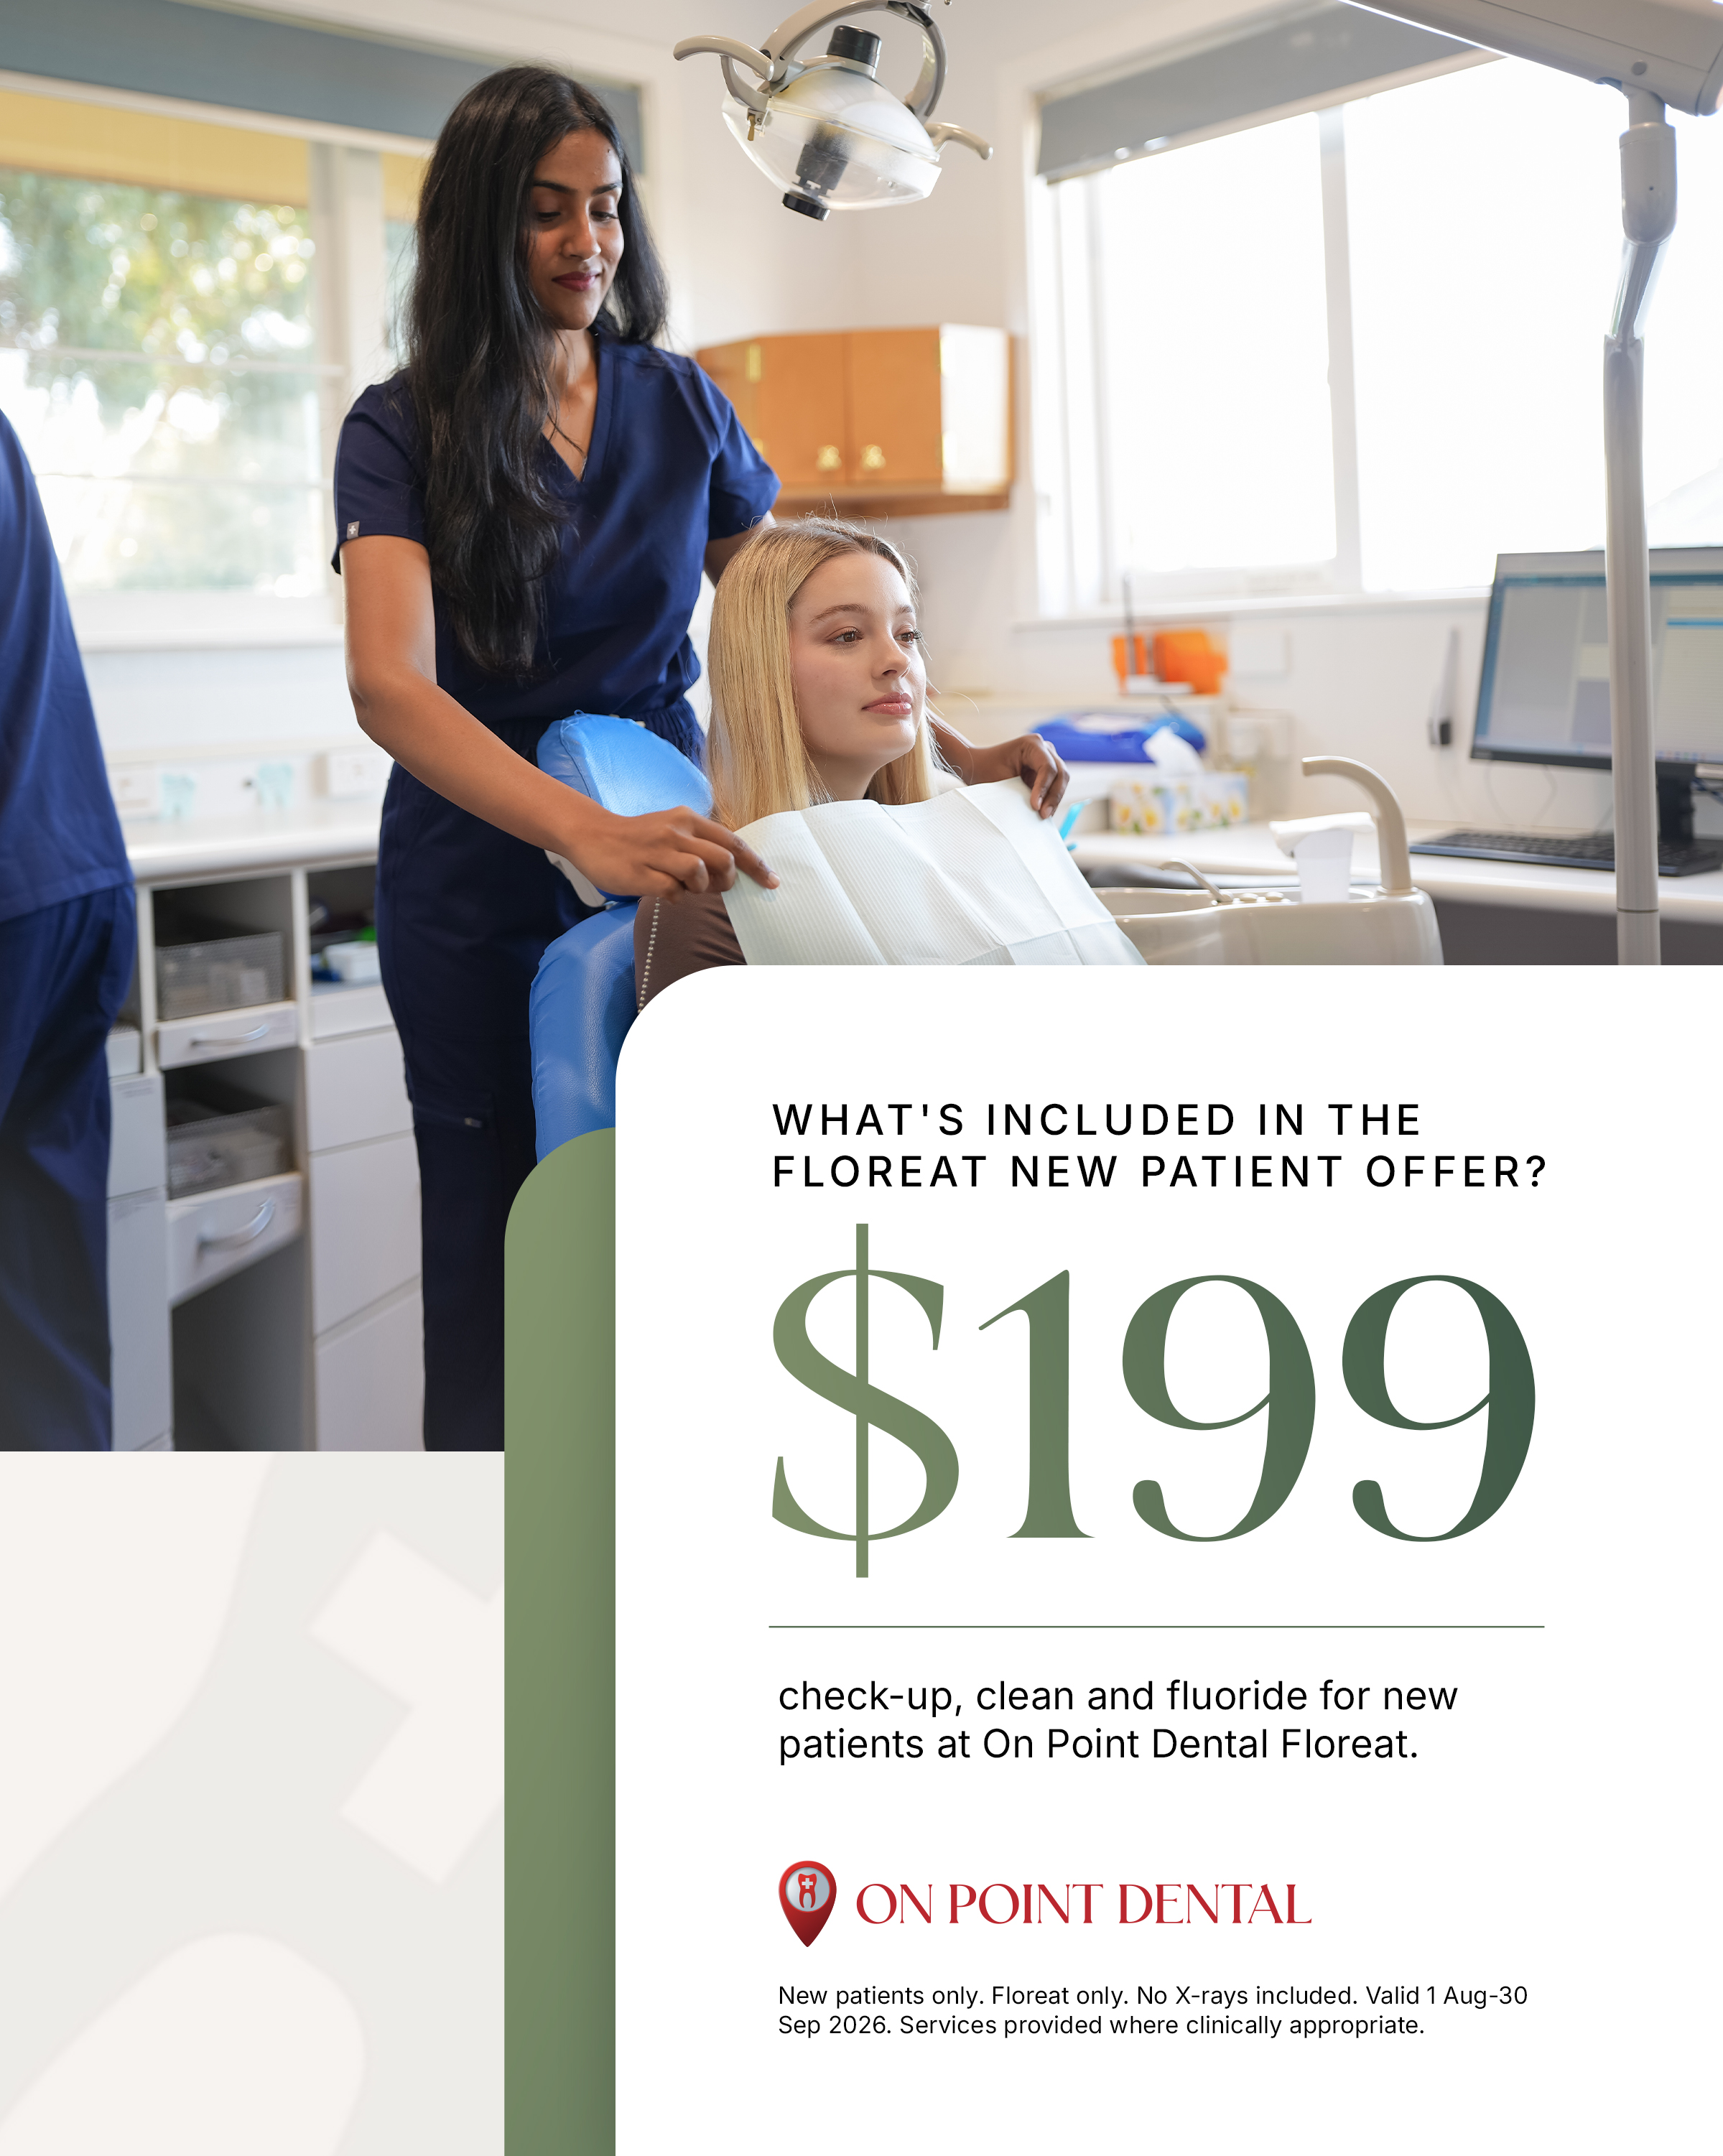
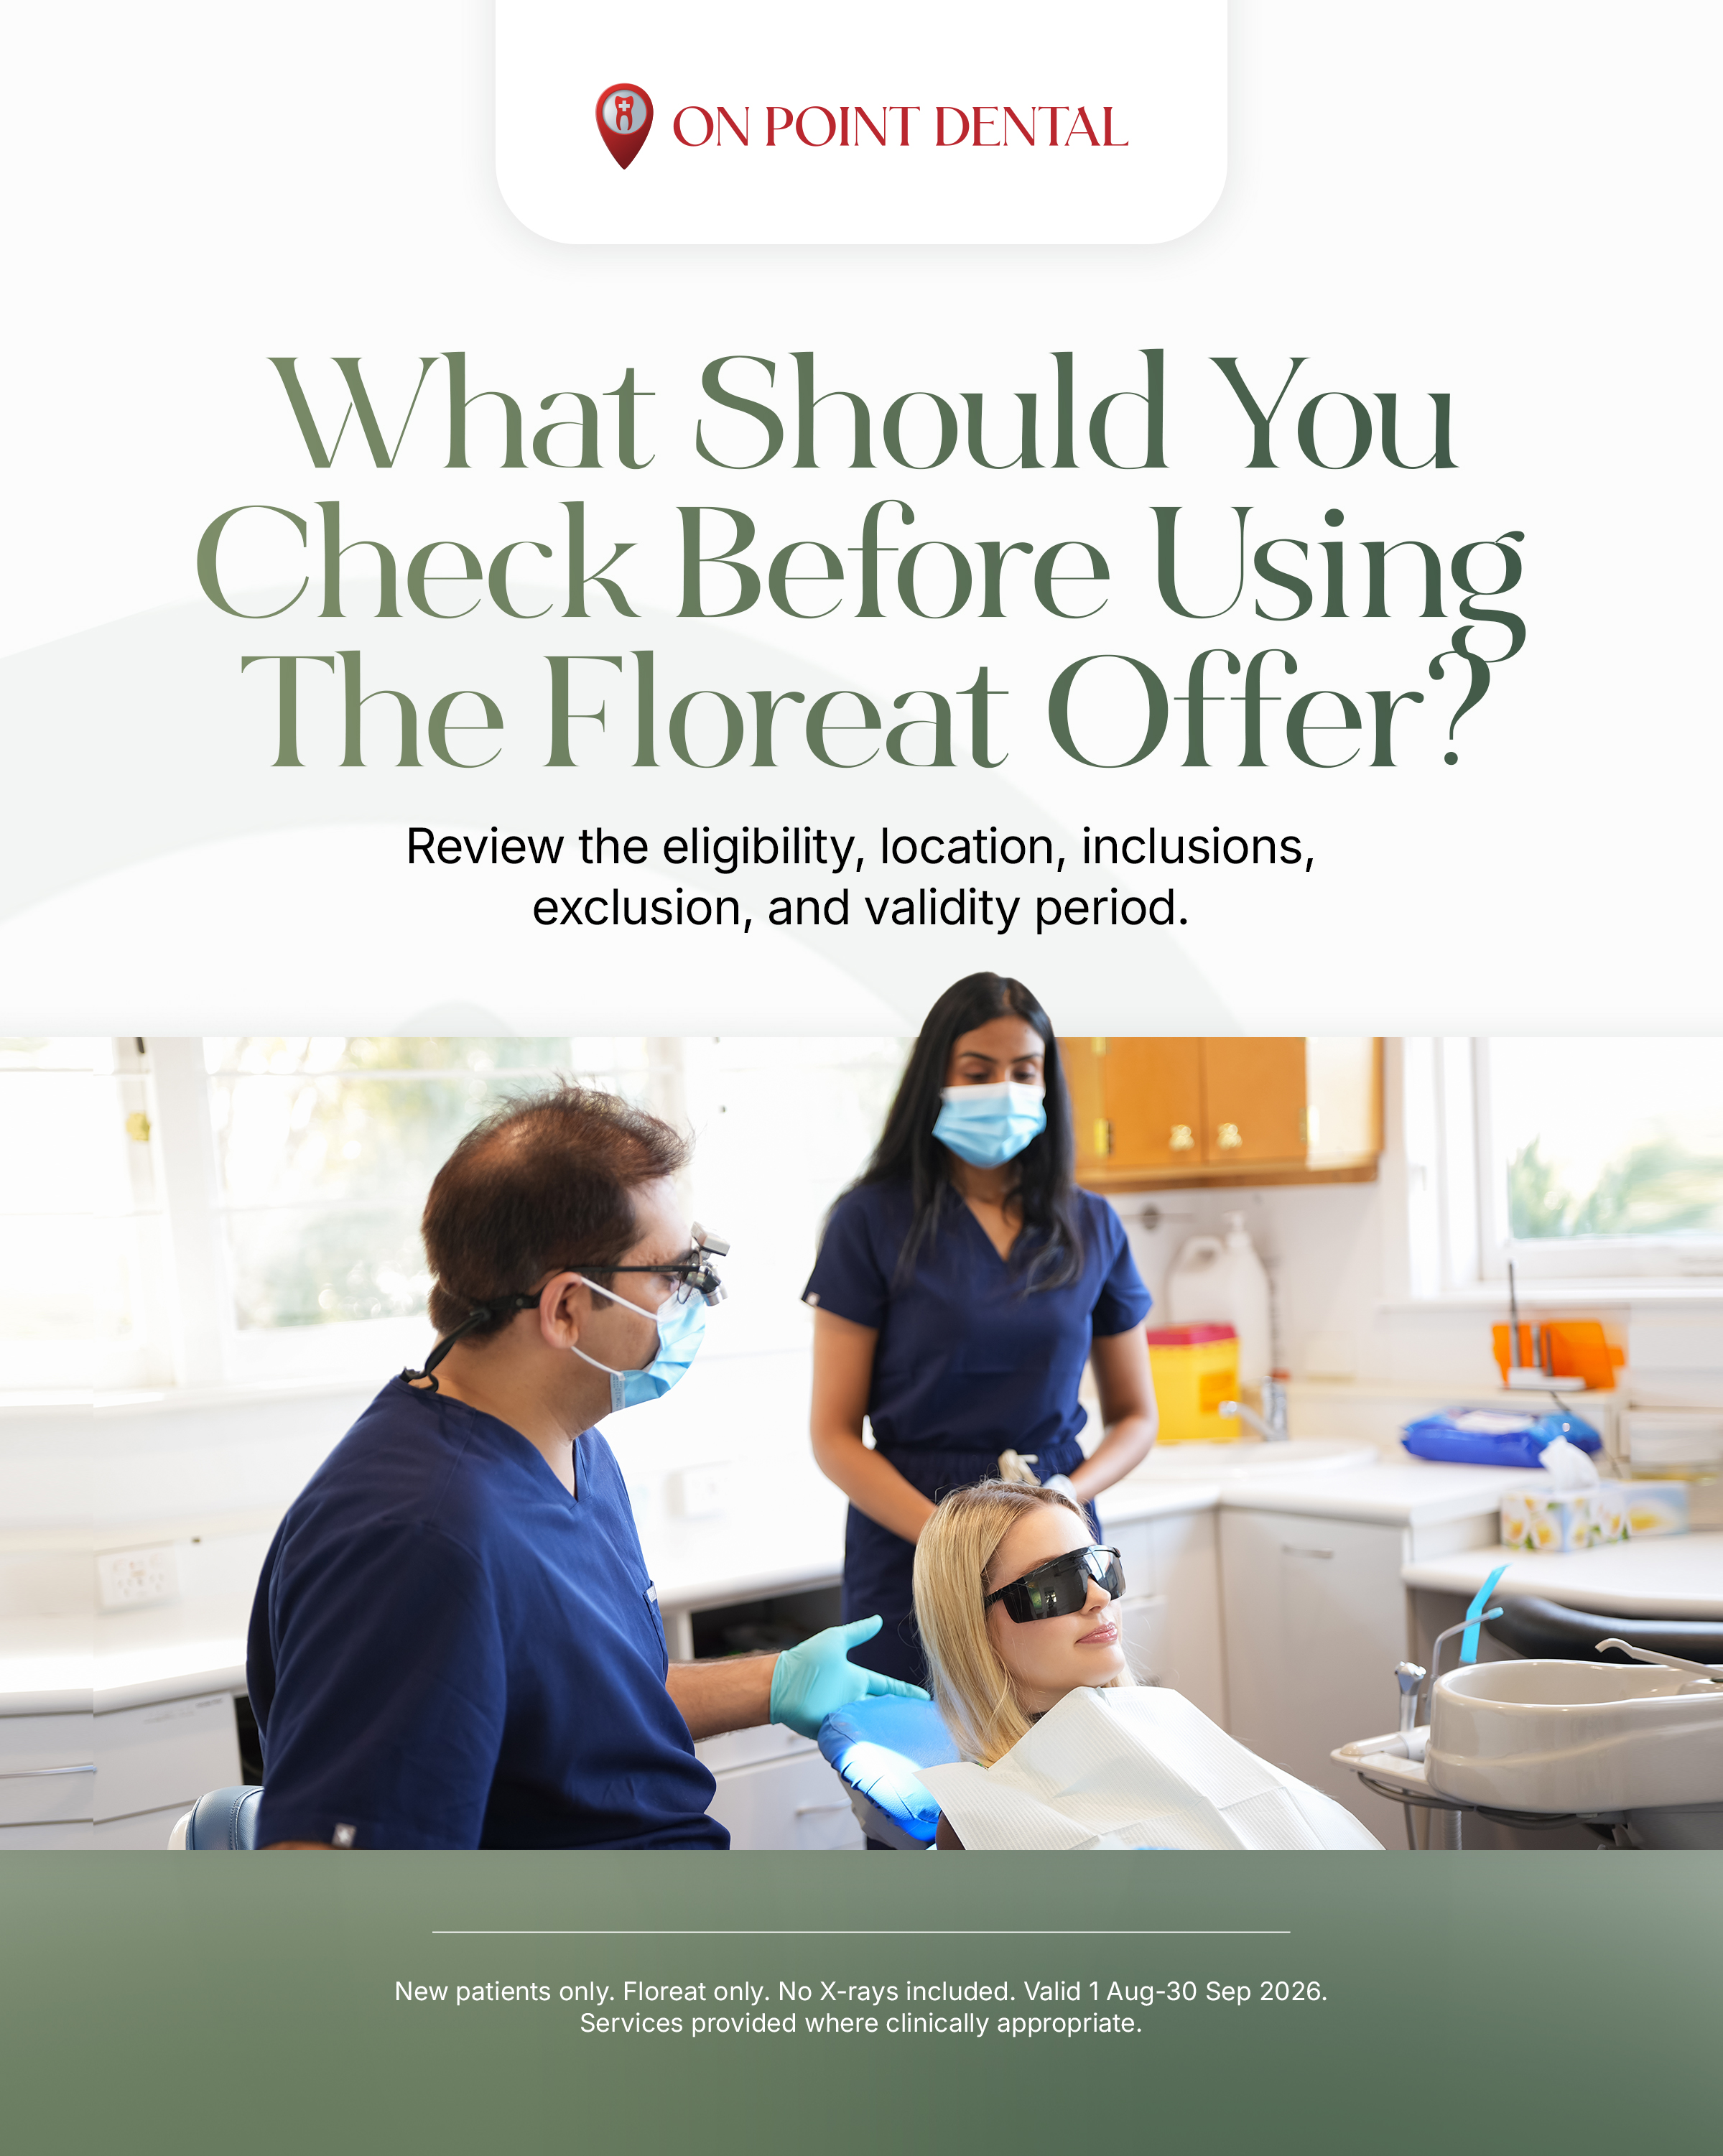
- Offers: the $199 new patient check-up, clean and fluoride offer at Floreat for eligible patients (1 August to 30 September 2026), and a $699 teeth whitening offer promoted in September.
- Clinic and team: clinic looks and front desk posts, including a closer look at On Point Dental Floreat.
- Where we show up: Floreat is named in 32 pieces and Wagin in 13; all three clinics publish through the On Point Dental accounts.
05 / Response
Engagement on published posts
Platform-reported interactions available in the publishing data.
| Platform | Likes | Comments | Shares |
|---|---|---|---|
| 34 | 5 | 1 | |
| 56 | 2 | 0 | |
| TikTok | 70 | 0 | 0 |
| Total | 160 | 7 | 1 |
Platform-reported counts as pulled on 15 October 2026. Reach and views are not in the publishing data, so they are not shown. Google Business Profile posts do not report engagement here.
06 / Archive
Published creative library
Browse all 55 pieces by month, with links to their live posts.
Select a month to view its thumbnails. Platform labels open each published version in a new tab.